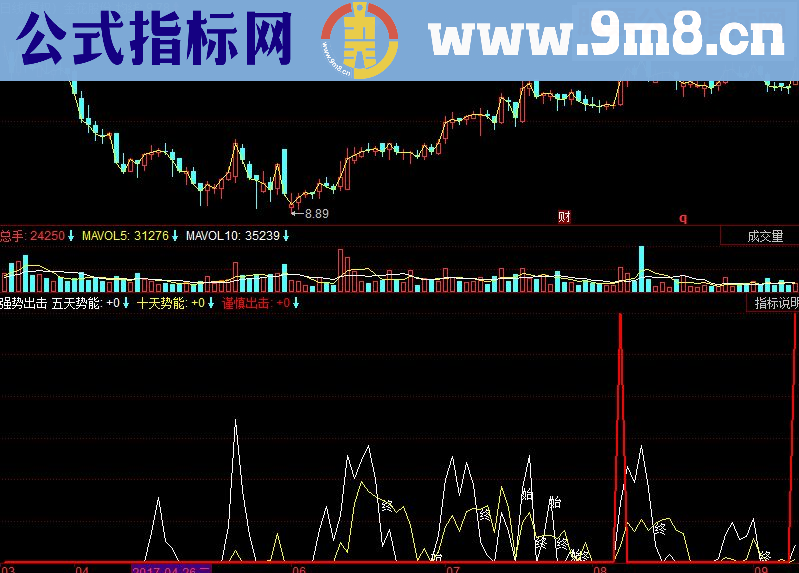
白色曲线为牛熊分割线,红色K线有效突破白线为买入信号,后势上涨概率较大;反之蓝色K线在白线以下为空头市场,上涨压力较大。
牛熊线:EXPMA(CLOSE,18);
STICKLINE(C =牛熊线 AND C =O,C,O,4,0),colorred;
STICKLINE(C =牛熊线 AND C =O,H,L,0,0),colorred;
STICKLINE(C =牛熊线 AND C O,C,O,4,1),colorred;
STICKLINE(C =牛熊线 AND C O,O,H,0,0),colorred;
STICKLINE(C =牛熊线 AND C O,C,L,0,0),colorred;
STICKLINE(C 牛熊线 AND C O,C,O,4,1),colorblue;
STICKLINE(C 牛熊线 AND C =O,C,O,4,1),colorblue;
STICKLINE(C 牛熊线 AND C =O,H,L,0,1),colorblue;
STICKLINE(C 牛熊线 AND C O,C,H,0,1),colorblue;
STICKLINE(C 牛熊线 AND C O,O,L,0,1),colorblue;
收盘线:C;


