源码
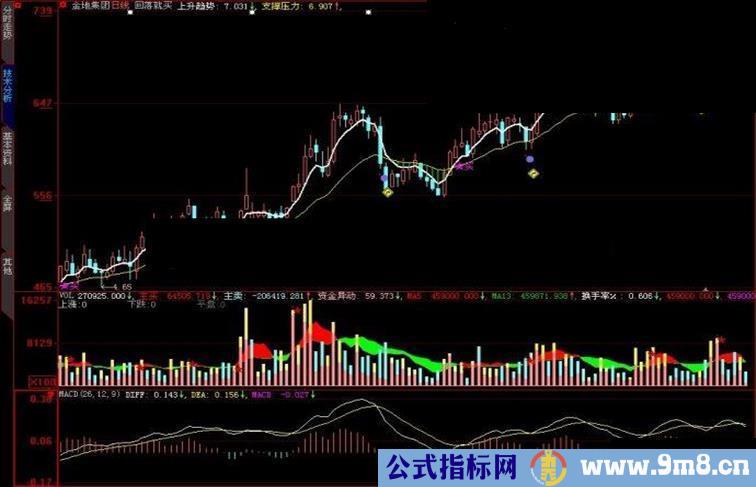
上升趋势:EMA(CLOSE,5),colorwhite,linethick2;
支撑压力:EMA(CLOSE,21),coloryellow,linethick1;
Y:=EMA(CLOSE,10);x:=EMA(CLOSE,16);
STICKLINE(上升趋势<支撑压力,支撑压力,上升趋势,0.1,0)
,color00ff00,linethick1;
DRAWTEXT(CROSS(上升趋势,支撑压力),上升趋势,'★买')
,ColorFF00FF;
drawtext((C<=x)and(上升趋势>Y),l*0.99,'●'),colore66878;
DRAWICON((C<=x)and(上升趋势>Y),l*0.97,4);