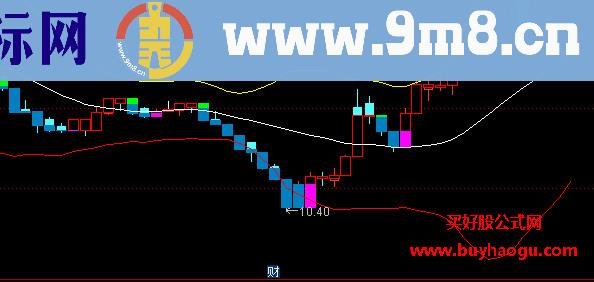
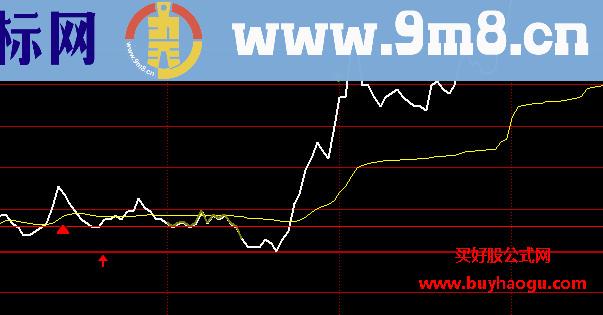
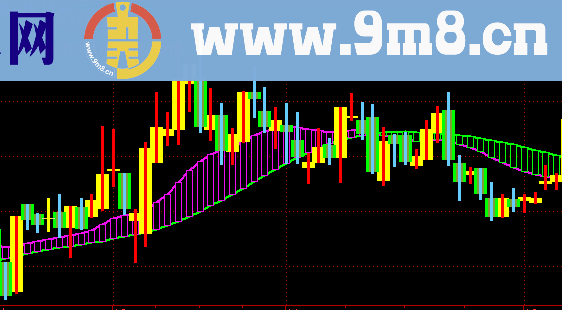
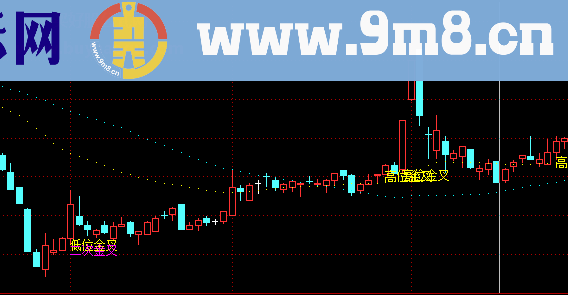
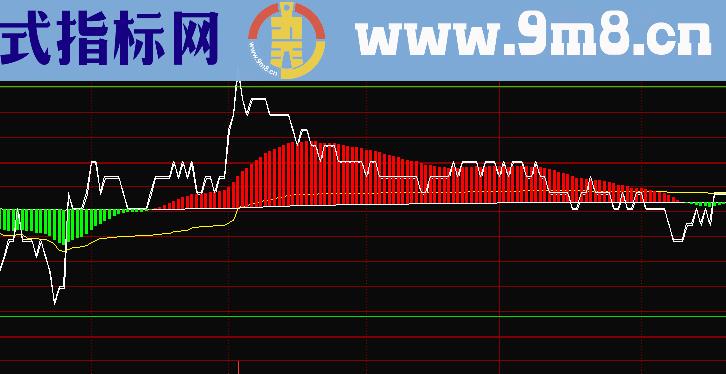
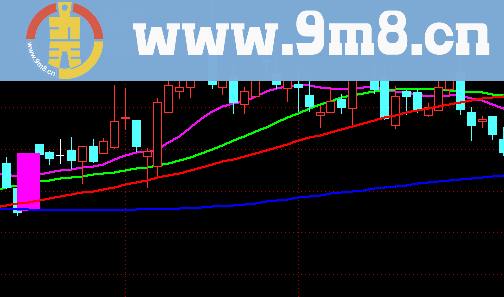
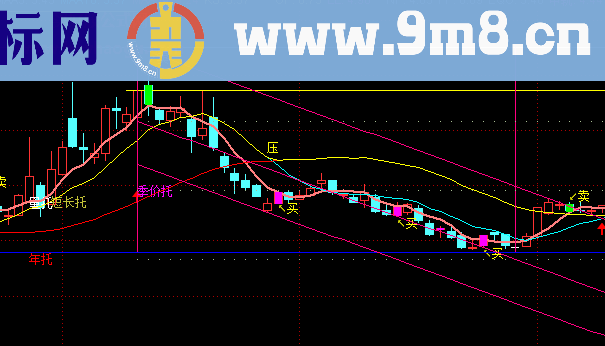
将近几年的每月的第一个交易日标记,看看历史轨迹,是有帮助的,可以把源码添加到自己的主图中或附图中,且只在日线图中显示。看看下图大盘 今年前期 趴者5个月才构造了一波像样的反弹看时间点还是比较清晰的
源码:
日时转换:=IF(DATATYPE=8,1,0);
月:=MONTH;
日:=DAY;
VERTLINE(日=1 AND 日时转换 0,1),COLORyellow;
VERTLINE(日=2 and weekday=1AND 日时转换 0,1),COLORyellow;
VERTLINE(日=8 and 月=10 and year=2010 AND 日时转换 0,1),COLORyellow;
VERTLINE(日=9 and 月=10 and year=2009 AND 日时转换 0,1) ,COLORyellow;
VERTLINE(日=6 and 月=10 and year=2008 AND 日时转换 0,1) ,COLORyellow;
VERTLINE((日=8 and 月=10 and year=2007) or (日=9 and 月=10 and year=2006) or (日=10 and 月=10 and year=2005) AND 日时转换 0 ,1),COLORyellow;
VERTLINE((日=4 and 月=1 AND 日时转换 0) OR (日=5 and 月=1 and year=2009 AND 日时转换 0),1) ,COLORred;
VERTLINE(日=2 and 月=1 and year=2008 AND 日时转换 0 ,1),COLORyellow;
VERTLINE(日=8 and 月=5 and year=2007 AND 日时转换 0,1),COLORyellow;
VERTLINE(日=3 and weekday=1 AND 日时转换 0,1),COLORyellow;
VERTLINE(日=5 and 月=5 AND 日时转换 0,1),COLORyellow;1

