有人说,山下湖的近期走势和绿大地,如出一辙,实际上用筹码峰分析,两股差异还是天壤之别的,这是不是就是我们透过k线表面现象看到的本质呢?
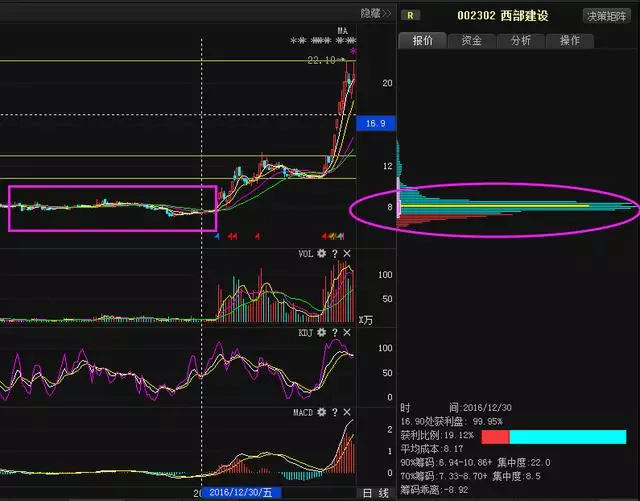
个人对筹码峰密集、分散理解如下:
筹码峰密集:波峰越少越高,就越密集,极端情况是一根横线;
筹码峰分散:波峰越多越矮,则越分散,极端情况是一根竖线。
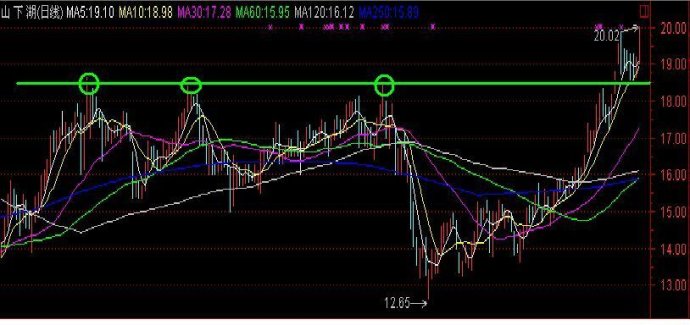
一、大的趋势来讲,应该是个三重顶的突破,如下图:
二、筹码峰变化过程观察,如下系列图
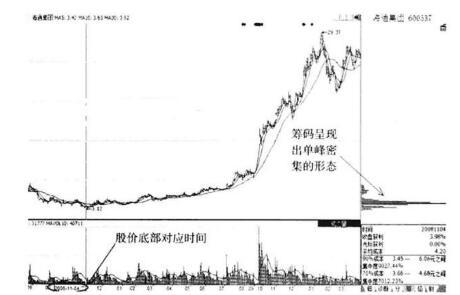
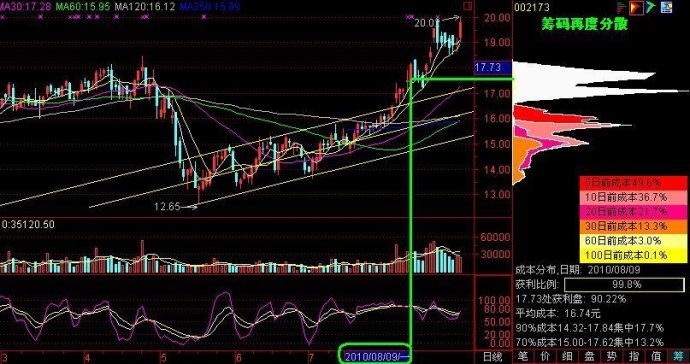
1、大跌后,呈现分散状态、大部分筹码被套,获利比例仅剩3.4%
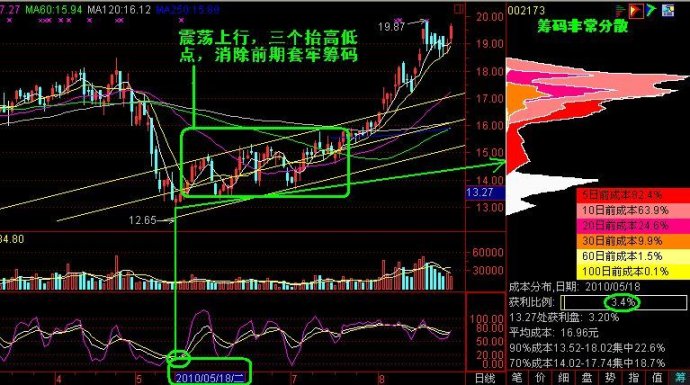
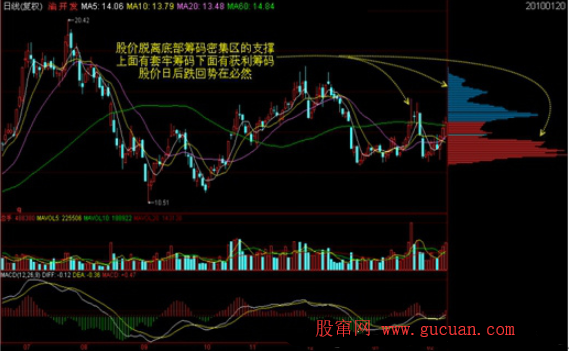
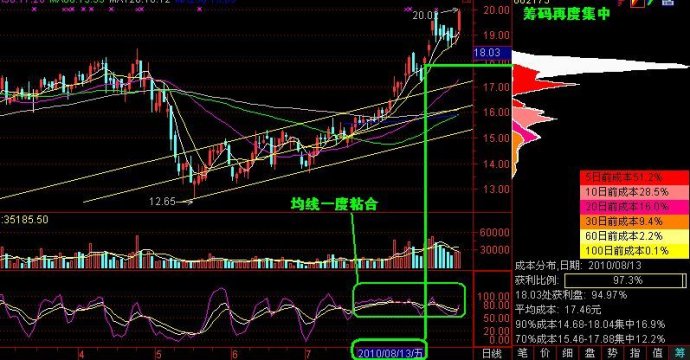
2、震荡上行后,前期套牢筹码在大盘整体趋势向下情况下,纷纷离场,正中主力下怀,筹码再度集中

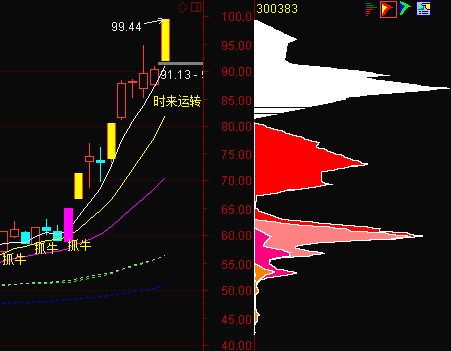
3、拉升到前期三重顶附近,大盘整体趋势向好大背景下,跟风资金众多,筹码再度分散,遭遇多重压力,获利比例高达99.8%。
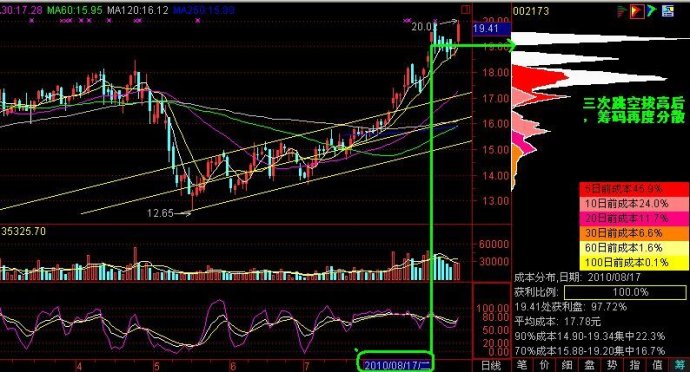
4、高位首度三次串阴洗盘后,立刻来个放量跳空上涨,浮筹洗掉不少,筹码再度集中
5、三次跳空放量上涨后,换手率及其异常,获利比例高达100%,筹码再度分散成三个白色高峰
6、2010-8-25、借助大盘调整,连续5连阴,高位串阴再次洗盘,筹码再度高位密集
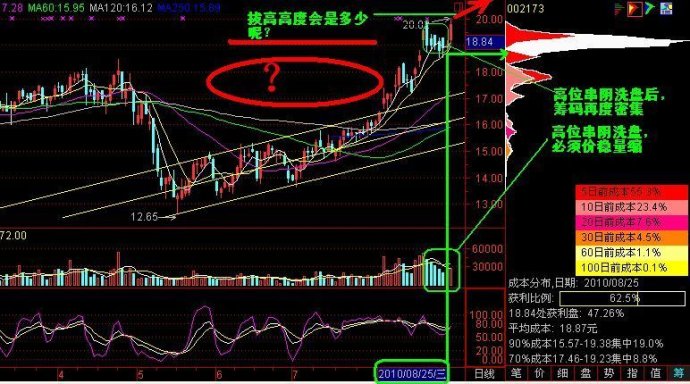
三、高度会是多少?
截至今天中午收盘,价格为19.8元,还能走多高,我不知道,也不想做无谓的预测了,选择卖点也是门学问,只能是随后伺机而动了。